Overview
Reports help in making better business decisions. Reports that are made of carefully selected data and sound analysis provide guidance for a more effective inventory management. Order Time offers a dynamic and simple-to-use Reports tool. The task of setting different report variables, which usually takes time and effort, is now quick and uncomplicated with the Reports tool.
Types of Reports
There are different types of reports that can be generated with the Reports tool. Choosing the report type depends on the level of details that you want to appear on the report. You can select the report type from the Render Type picklist in the Customize Report page. The following are the different types of reports:
- Tabular - The reports are usually more detailed. The information in this type of report are broken down to specific data which are typically presented in rows and columns.
- Summary - The reports are based on stand-alone details that can provide the gist of the information. This may also mean fewer tables and columns depending on your criteria.
- Pivot - The reports are formed by applying pivot, data and rows which are processed by different operations such as counting, averaging or summing.
Creating Reports
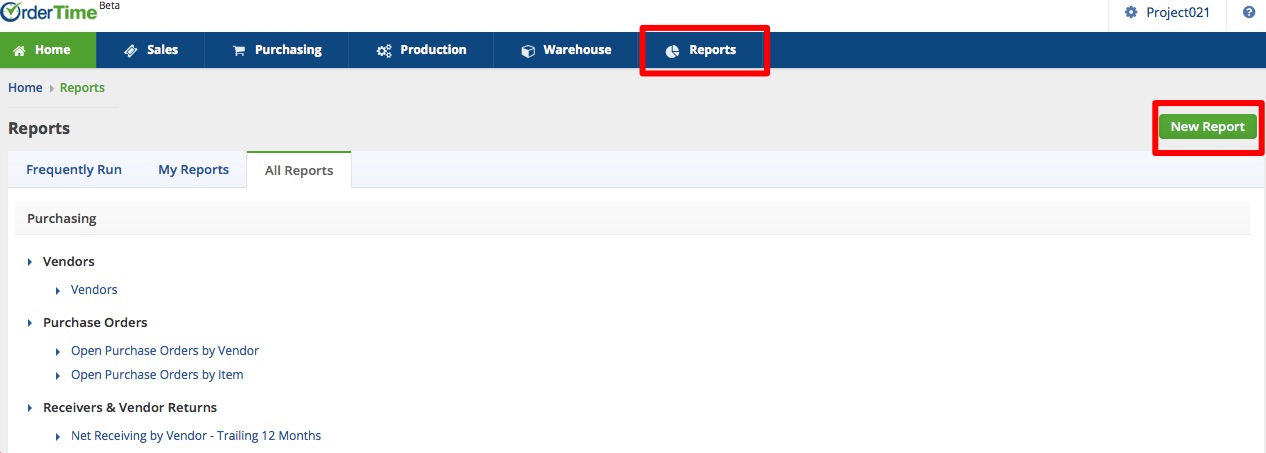
In the Reports main page, reports are classified in to tabs: Frequently Run, My Reports and All Reports. You can easily access saved reports by clicking the appropriate tab.
- Click Reports.
- Click on the New Report button.
On the next screen, you will see the New Report page, which contains the report source groupings. Each report source grouping contains tables and columns that you can include in your reports. This will allow you to select the type of information such as fields and tables that you want to reflect on your reports.
- Click the link of the report that you want to create/generate.
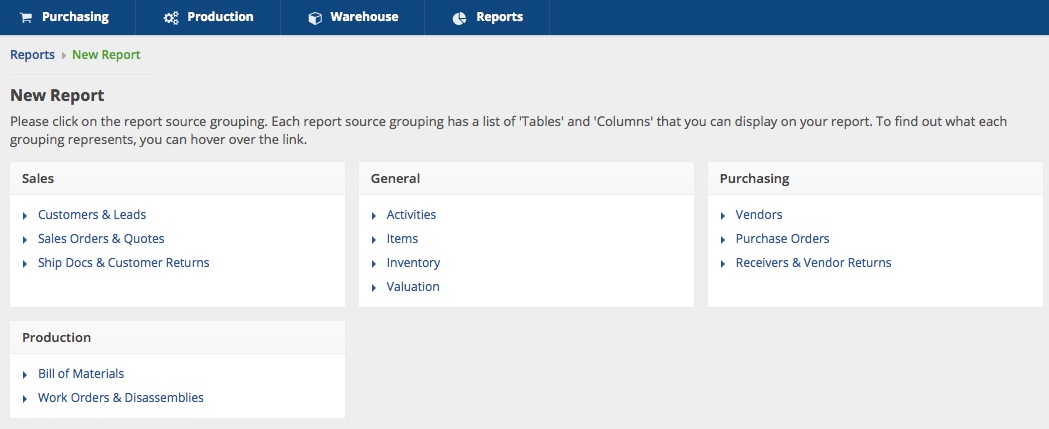
- Click the link of the report that you want to create/generate.
- Add the tables and columns to form the report. The steps for adding tables and columns are listed below.


- Adding Tables
The Customize Report page will display the Tables list on the left side of the screen after you click the link of the report that want to create. This is a list of tables that are relevant to the type of report that you selected.The Tables tab will also be available. This is where you will place the tables that you want to include in the report. 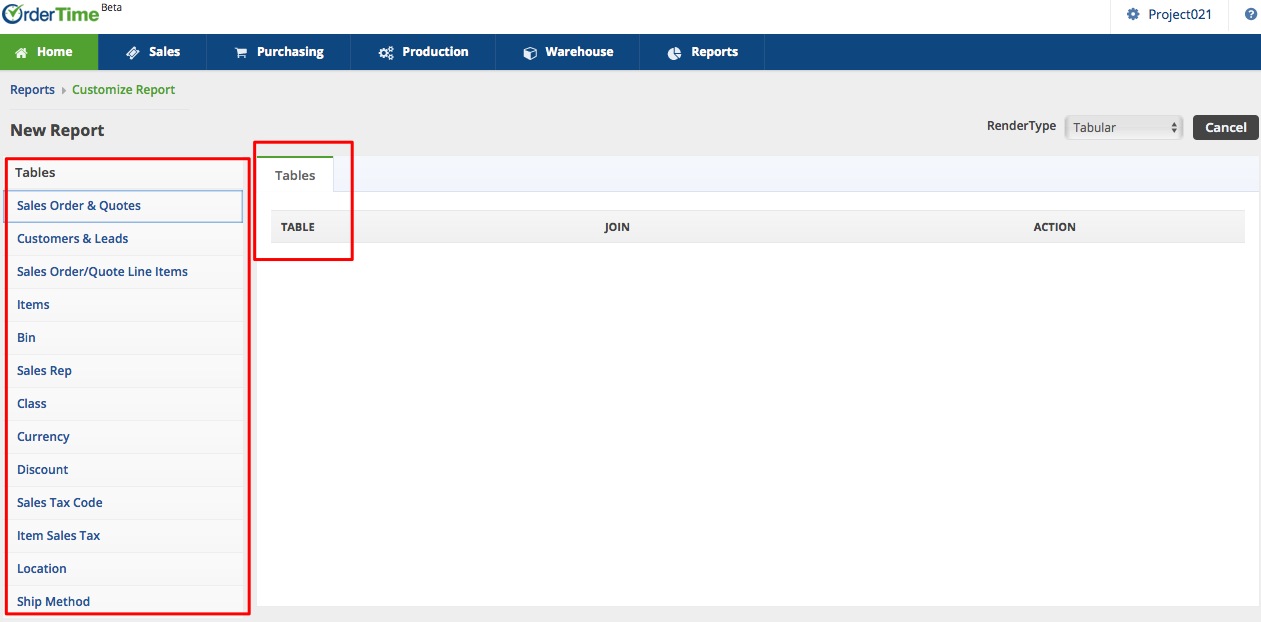
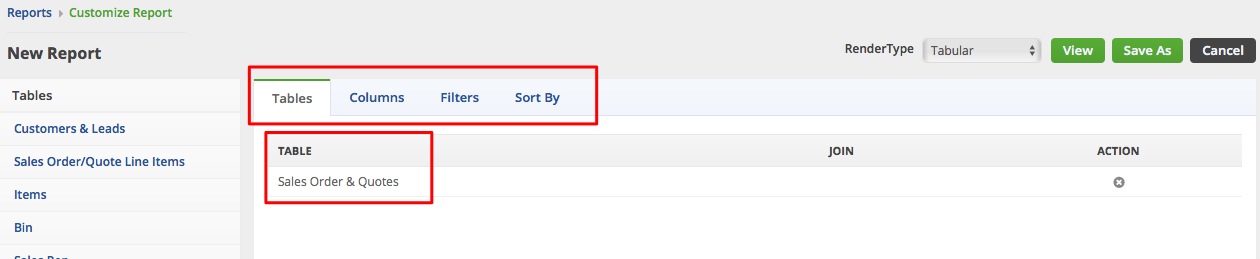
Select and drag the table name inside the box of the Tables tab. Once the table is selected, the page will display more tabs. The additional tabs are: Columns, Filters and Sort By.
The order of the table is important because it will dictate what other tables will be available to join the to initially selected table.
To join another table with the first table, drag and drop the table inside the box. At this point you are associating 2 tables. Once the tables are associated, their names are displayed under the Join column. Repeat this step if you want to join more tables with your primary table.
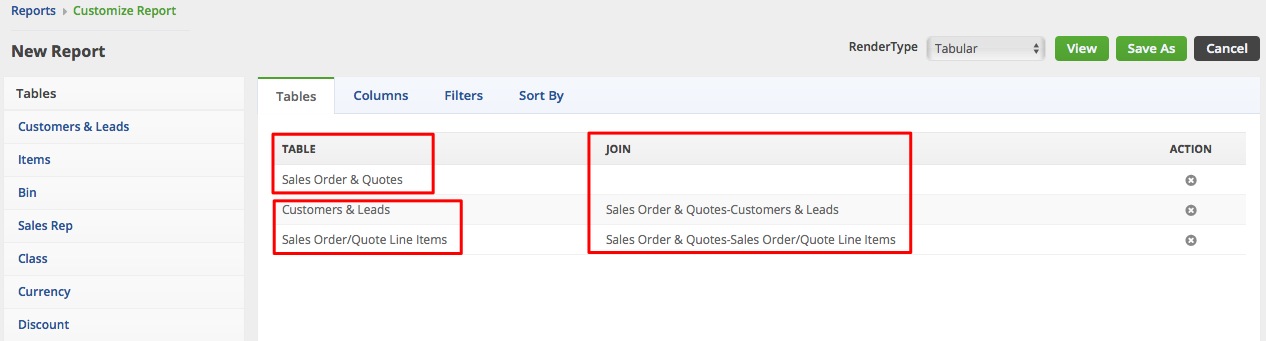
There are certain tables that can be joined with more than one preceding tables. You will know if a table can be associated or joined with another table when options appear at the bottom of the interface. This provides you the option to join a specific table to another table aside from the primary table. 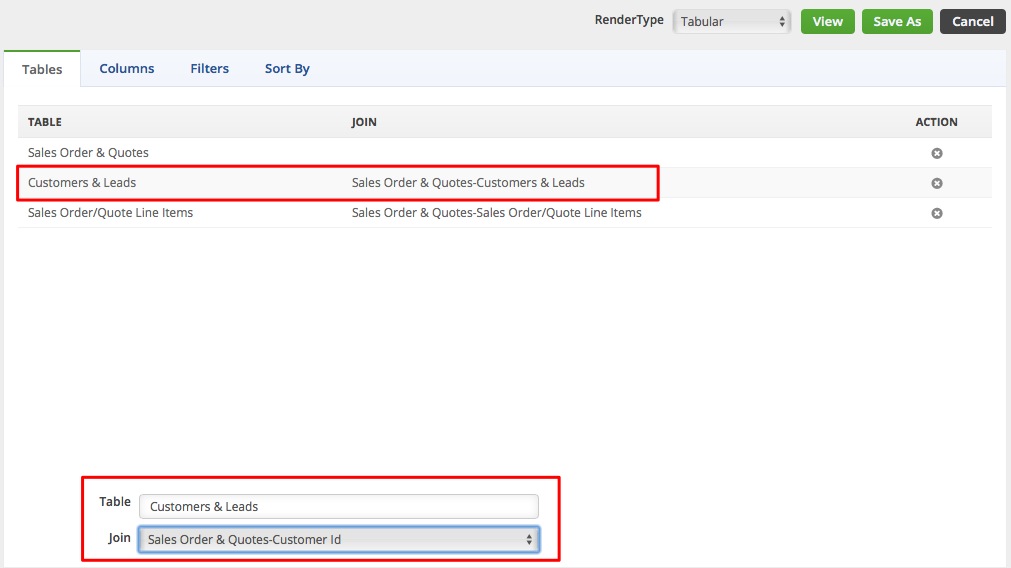
If you want to join a table for the second time and join it with a table other than the primary table, drag the table from the Tables list and drop it in the box. You can also rename the table by using the Table field. 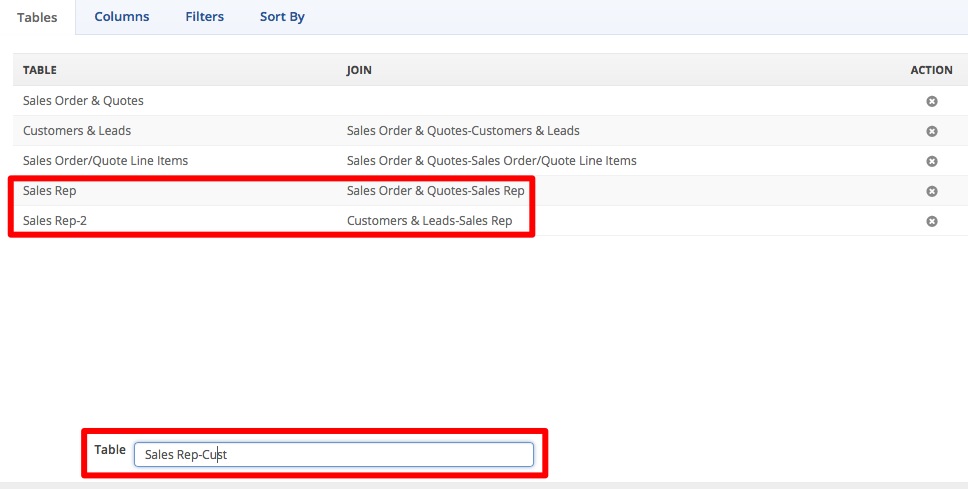
Repeat the steps above if you want to add more tables.
- Adding Columns
When you have established your tables, you can proceed to building the details of your report by adding columns.
- Click the Columns tab to begin adding columns.
The tables that you selected are listed on the left side of the screen.
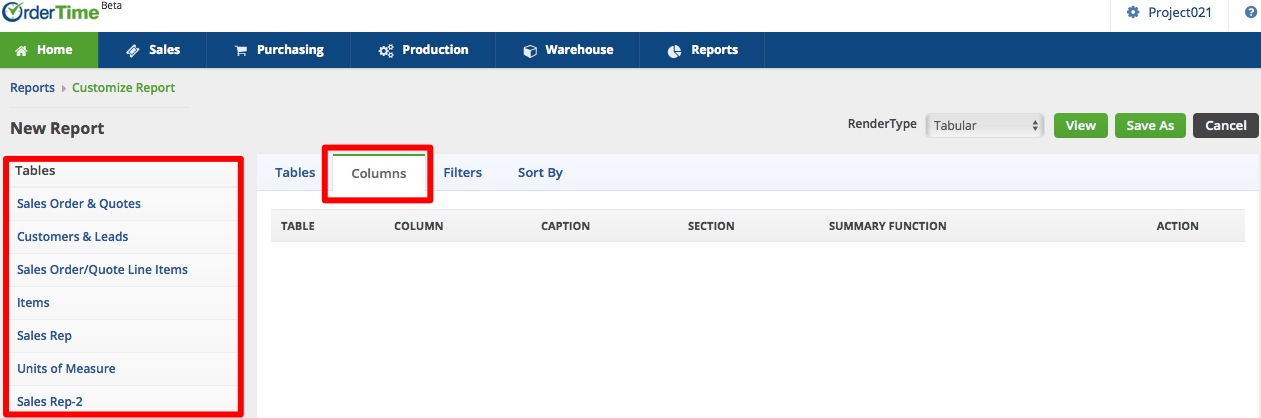
2. Click the table name to expand the list and see the column names for that table.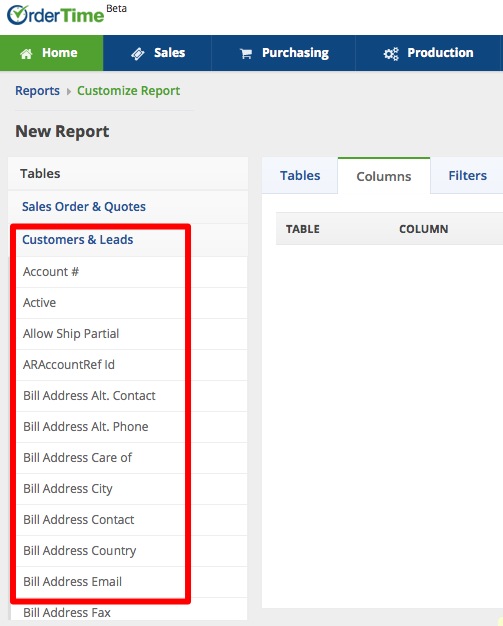
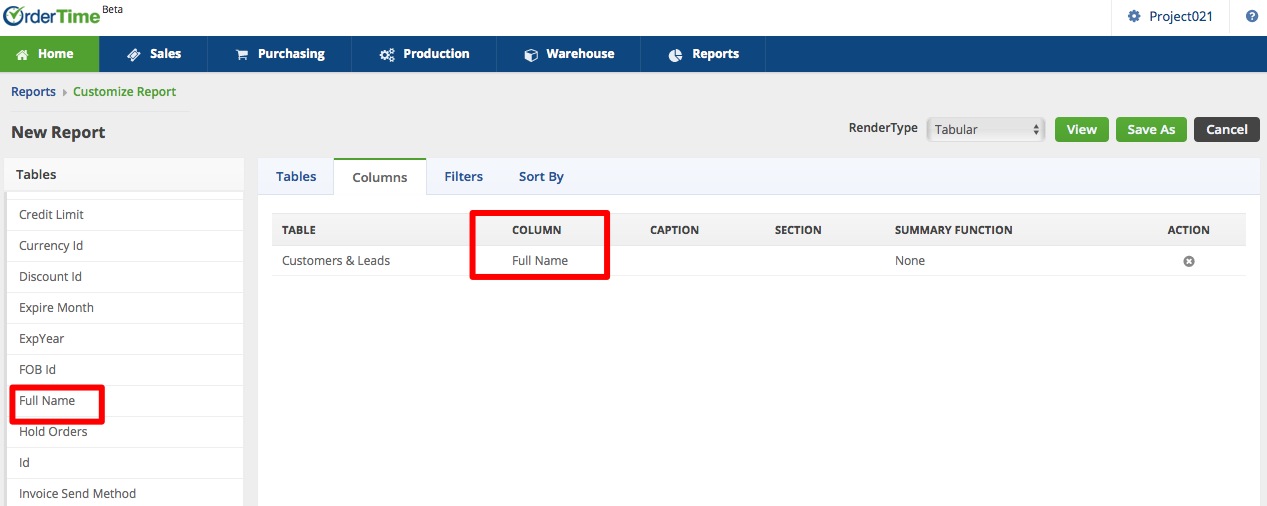
3. Select the columns that you want to include in the report by dragging and dropping the column name inside the box. Depending on your report requirements and the details that you want to have, you can add more columns by repeating this step.
4. Click Save As. Enter a name for the report. Click OK.
Viewing Reports
You may view your report at anytime during the report creation by clicking View. You can also rearrange the order of the rows in the Columns tab by dragging the row(s) to your desired spot.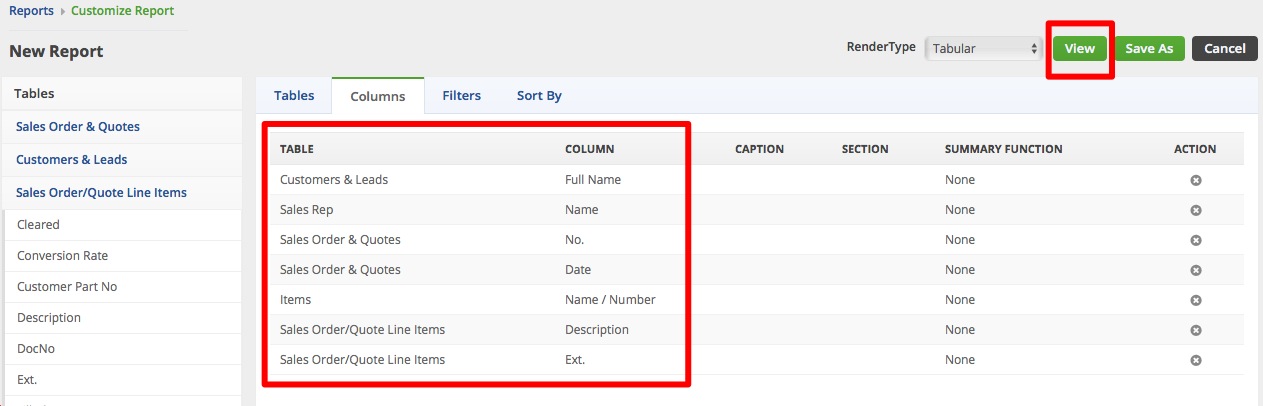
The next screen will display the View Report page where you can see the report.
There are also other options available in the View Report page:
- Export - to export your file onto your local directory.
- Print - to obtain a hard copy of the report
- Customize Report - to modify the report based on your requirement specifications
- Save - to save the report
- Save As - to save the report with another name.
- Delete - to remove the report from the system
Summary Reports
You can opt to have a Summary Report if you want a concise version of a report.
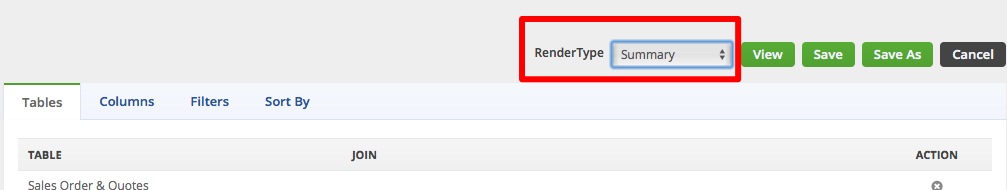
- Click New Report from the Reports page OR click the Customize Report button if you have an existing report that you want to change to Summary.
- Select the Summary from the Render Type picklist.
- Select the tables and columns that you want to include in the report by dragging and dropping the table and column names inside the box.
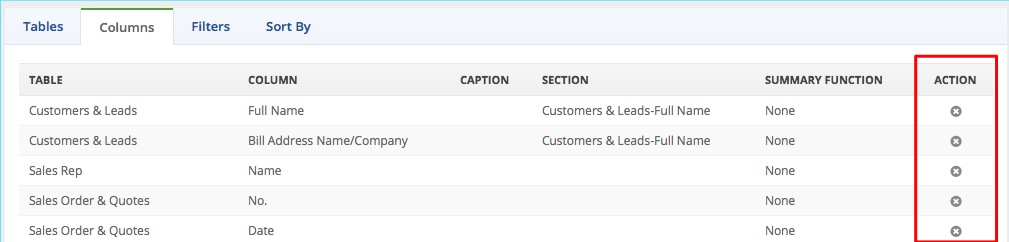
- Refine the level of details of the report by removing columns. Click the Delete Column icon under the Action column.
- Click Save or Save As.
- Click View to check the summary report.


Note: You can make a summary report even without doing a detailed/tabular report first.
Pivot Reports
You can also do matrix reporting by creating a Pivot report.
Click New Report from the Reports page OR click the Customize Report button if you have an existing report that you want to change to Pivot.
- Select Pivot from the Render Type picklist.
- Choose the tables and columns that you want to include in the report by dragging and dropping the table and column names inside the box.
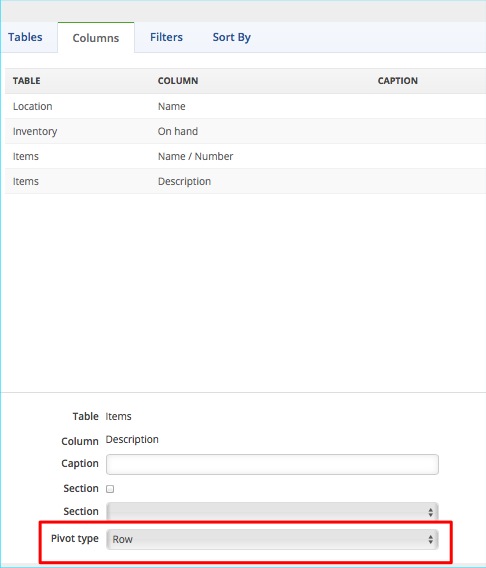
- Select the corresponding Pivot Type from the picklist for each of your column. Important: You have to have at least three (3) columns: only one(1) Pivot, only one (1) Data and 1 or more Rows
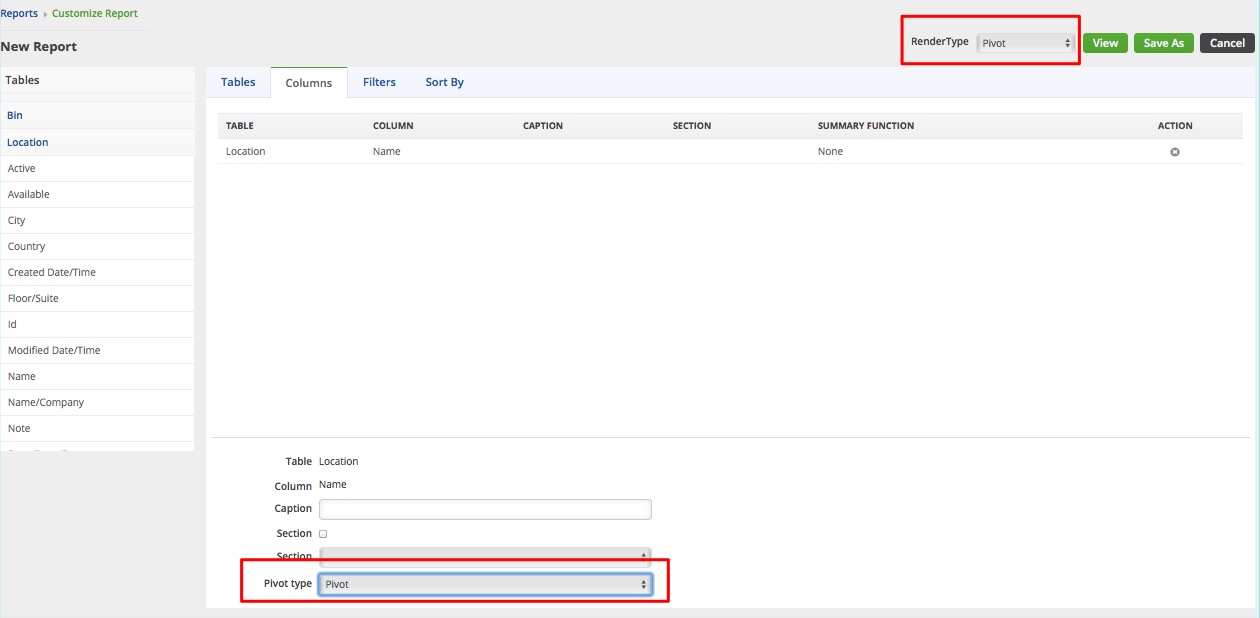

- Pivot: You can enter a Caption.
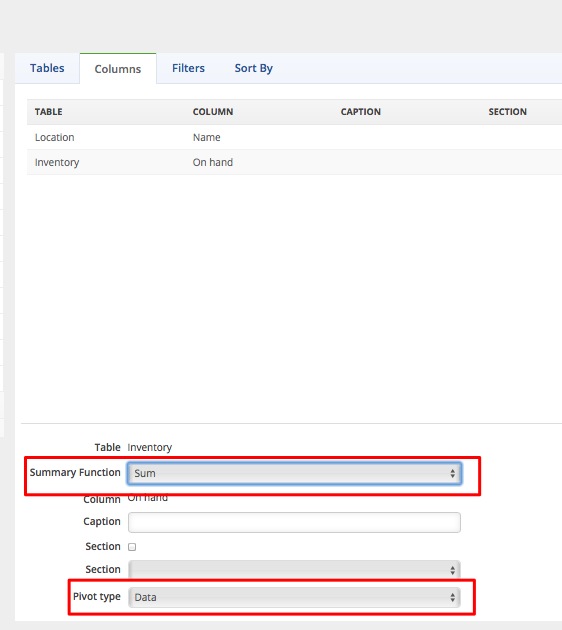
- Data: Select the Summary Function from the picklist. You can also enter a Caption.
- Row: You can select Section and enter a Caption.


4. Click Save or Save As.
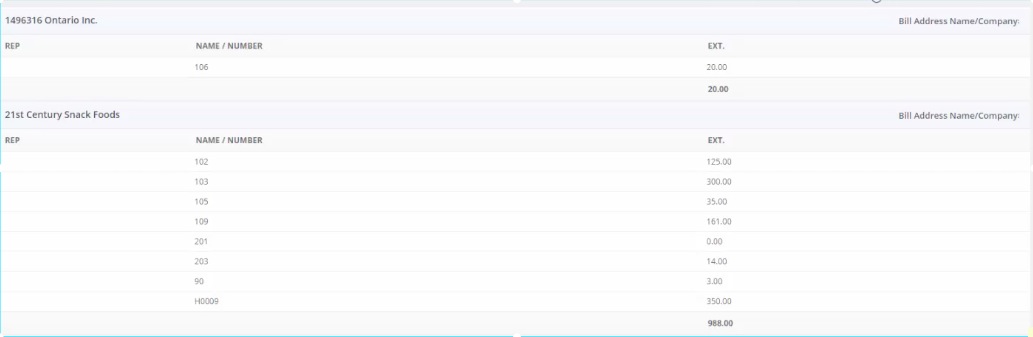
5. Click View to see the report.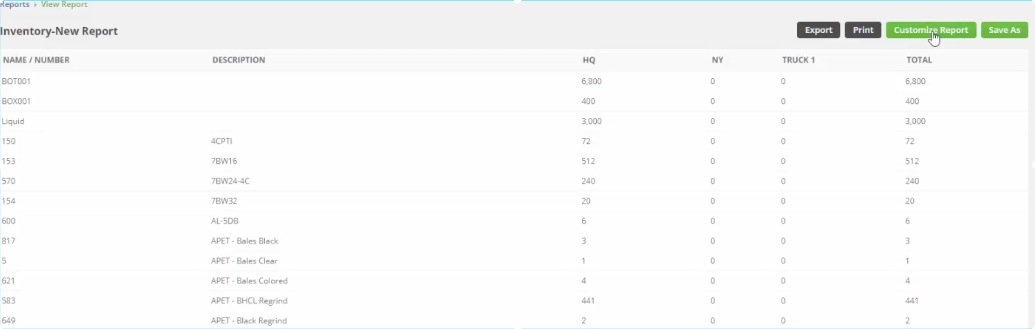
NEXT: Customizing Reports
